Null hypothesis
n., plural: null hypotheses
[nʌl haɪˈpɒθɪsɪs]
Definition: a hypothesis that is valid or presumed true until invalidated by a statistical test
Table of Contents
Null Hypothesis Definition
Null hypothesis is defined as “the commonly accepted fact (such as the sky is blue) and researcher aim to reject or nullify this fact”.
More formally, we can define a null hypothesis as “a statistical theory suggesting that no statistical relationship exists between given observed variables”.
In biology, the null hypothesis is used to nullify or reject a common belief. The researcher carries out the research which is aimed at rejecting the commonly accepted belief.
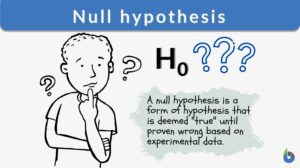
A null hypothesis is an assumption or proposition where an observed difference between two samples of a statistical population is purely accidental and not due to systematic causes. It is the hypothesis to be investigated through statistical hypothesis testing so that when refuted indicates that the alternative hypothesis is true. Thus, a null hypothesis is a hypothesis that is valid or presumed true until invalidated by a statistical test. And so, one cannot say that a null hypothesis is ‘’accepted’’ rather it “cannot be rejected” as it remains to be true based on the statistical evidence supporting it. Conversely, a null hypothesis that is refuted can be said to have been“rejected”. Word origin: coined by the English geneticist and statistician Ronald Fisher. Symbol: H0. Compare: alternative hypothesis
What Is a Null Hypothesis?
A hypothesis is defined as a theory or an assumption that is based on inadequate evidence. It needs and requires more experiments and testing for confirmation. There are two possibilities that by doing more experiments and testing, a hypothesis can be false or true. It means it can either prove wrong or true (Blackwelder, 1982).
For example, Susie assumes that mineral water helps in the better growth and nourishment of plants over distilled water. To prove this hypothesis, she performs this experiment for almost a month. She watered some plants with mineral water and some with distilled water.
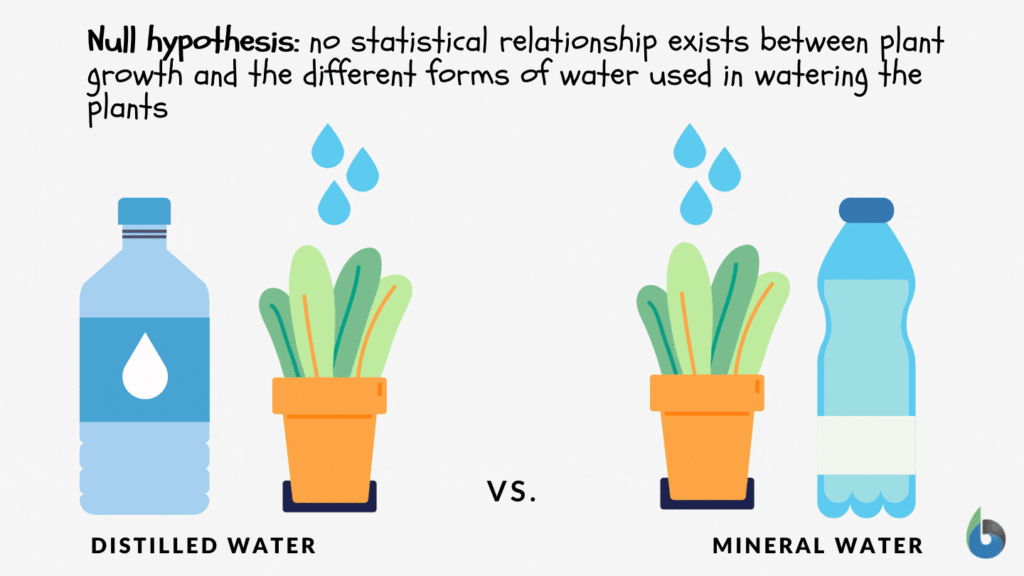
In a hypothesis when there are no statistically significant relationships among the two variables, the hypothesis is said to be a null hypothesis. The investigator is trying to disprove such a hypothesis. In the above example of plants, the null hypothesis is:
There are no statistical relationships among the forms of water that are given to plants for growth and nourishment.
Usually, an investigator tries to prove the null hypothesis wrong and tries to explain a relation and association between the two variables.
An opposite and reverse of the null hypothesis are known as the alternate hypothesis. In the example of plants the alternate hypothesis is:
There are statistical relationships among the forms of water that are given to plants for growth and nourishment.
The example below shows the difference between null vs alternative hypotheses:
Alternate Hypothesis: The world is round
Null Hypothesis: The world is not round.
Copernicus and many other scientists try to prove the null hypothesis wrong and false. By their experiments and testing, they make people believe that alternate hypotheses are correct and true. If they do not prove the null hypothesis experimentally wrong then people will not believe them and never consider the alternative hypothesis true and correct.
The alternative and null hypothesis for Susie’s assumption is:
- Null Hypothesis: If one plant is watered with distilled water and the other with mineral water, then there is no difference in the growth and nourishment of these two plants.
- Alternative Hypothesis: If one plant is watered with distilled water and the other with mineral water, then the plant with mineral water shows better growth and nourishment.
The null hypothesis suggests that there is no significant or statistical relationship. The relation can either be in a single set of variables or among two sets of variables.
Most people consider the null hypothesis true and correct. Scientists work and perform different experiments and do a variety of research so that they can prove the null hypothesis wrong or nullify it. For this purpose, they design an alternate hypothesis that they think is correct or true.
The null hypothesis symbol is H0 (it is read as H null or H zero).
Why is it named the “Null”?
The name null is given to this hypothesis to clarify and explain that the scientists are working to prove it false i.e. to nullify the hypothesis. Sometimes it confuses the readers; they might misunderstand it and think that statement has nothing. It is blank but, actually, it is not. It is more appropriate and suitable to call it a nullifiable hypothesis instead of the null hypothesis.
Why do we need to assess it? Why not just verify an alternate one?
In science, the scientific method is used. It involves a series of different steps. Scientists perform these steps so that a hypothesis can be proved false or true. Scientists do this to confirm that there will be any limitation or inadequacy in the new hypothesis. Experiments are done by considering both alternative and null hypotheses, which makes the research safe. It gives a negative as well as a bad impact on research if a null hypothesis is not included or a part of the study. It seems like you are not taking your research seriously and not concerned about it and just want to impose your results as correct and true if the null hypothesis is not a part of the study.
Development of the Null
In statistics, firstly it is necessary to design alternate and null hypotheses from the given problem. Splitting the problem into small steps makes the pathway towards the solution easier and less challenging.
how to write a null hypothesis?
Writing a null hypothesis consists of two steps:
- Firstly, initiate by asking a question.
- Secondly, restate the question in such a way that it seems there are no relationships among the variables.
In other words, assume in such a way that the treatment does not have any effect.
| Questions | Null Hypothesis |
|---|---|
| Are adults doing better at mathematics than teenagers? | Mathematical ability does not depend on age. |
| Does the risk of a heart attack reduce by daily intake of aspirin? | A heart attack is not affected by the daily dose of aspirin. |
| Are teenagers using cell phones to access the internet more than elders? | Age does not affect the usage of cell phones for internet access. |
| Are cats concerned about their food color? | Cats do not prefer food based on color. |
| Does pain relieve by chewing willow bark? | Pain is not relieved by chewing willow bark. |
Example:
The usual recovery duration after knee surgery is considered almost 8 weeks.
A researcher thinks that the recovery period may get elongated if patients go to a physiotherapist for rehabilitation twice per week, instead of thrice per week, i.e. recovery duration reduces if the patient goes three times for rehabilitation instead of two times.
Step 1: Look for the problem in the hypothesis. The hypothesis either be a word or can be a statement. In the above example the hypothesis is:
“The expected recovery period in knee rehabilitation is more than 8 weeks”
Step 2: Make a mathematical statement from the hypothesis. Averages can also be represented as μ, thus the null hypothesis formula will be.
H1: μ>8
In the above equation, the hypothesis is equivalent to H1, the average is denoted by μ and > that the average is greater than eight.
Step 3: Explain what will come up if the hypothesis does not come right i.e., the rehabilitation period may not proceed more than 08 weeks.
There are two options: either the recovery will be less than or equal to 8 weeks.
H0: μ ≤ 8
In the above equation, the null hypothesis is equivalent to H0, the average is denoted by μ and ≤ represents that the average is less than or equal to eight.
What will happen if the scientist does not have any knowledge about the outcome?
Example:
Problem: An investigator investigates the post-operative impact and influence of radical exercise on patients who have operative procedures of the knee. The chances are either the exercise will improve the recovery or will make it worse. The usual time for recovery is 8 weeks.
Step 1: Make a null hypothesis i.e. the exercise does not show any effect and the recovery time remains almost 8 weeks.
H0: μ = 8
In the above equation, the null hypothesis is equivalent to H0, the average is denoted by μ, and the equal sign (=) shows that the average is equal to eight.
Step 2: Make the alternate hypothesis which is the reverse of the null hypothesis. Particularly what will happen if treatment (exercise) makes an impact?
H1: μ≠8
In the above equation, the alternate hypothesis is equivalent to H1, the average is denoted by μ and not equal sign (≠) represents that the average is not equal to eight.
Significance Tests
To get a reasonable and probable clarification of statistics (data), a significance test is performed. The null hypothesis does not have data. It is a piece of information or statement which contains numerical figures about the population. The data can be in different forms like in means or proportions. It can either be the difference of proportions and means or any odd ratio.
The following table will explain the symbols:
| P | P-value |
| p | Probability of success |
| n | Size of sample |
| H0 | Null Hypothesis |
| Ha | Alternate Hypothesis |
P-value is the chief statistical final result of the significance test of the null hypothesis.
- P-value = Pr(data or data more extreme | H0 true)
- | = “given”
- Pr = probability
- H0 = the null hypothesis
The first stage of Null Hypothesis Significance Testing (NHST) is to form an alternate and null hypothesis. By this, the research question can be briefly explained.
Null Hypothesis = no effect of treatment, no difference, no association
Alternative Hypothesis = effective treatment, difference, association
When to reject the null hypothesis?
Researchers will reject the null hypothesis if it is proven wrong after experimentation. Researchers accept null hypothesis to be true and correct until it is proven wrong or false. On the other hand, the researchers try to strengthen the alternate hypothesis. The binomial test is performed on a sample and after that, a series of tests were performed (Frick, 1995).
Step 1: Evaluate and read the research question carefully and consciously and make a null hypothesis. Verify the sample that supports the binomial proportion. If there is no difference then find out the value of the binomial parameter.
Show the null hypothesis as:
H0:p= the value of p if H0 is true
To find out how much it varies from the proposed data and the value of the null hypothesis, calculate the sample proportion.
Step 2: In test statistics, find the binomial test that comes under the null hypothesis. The test must be based on precise and thorough probabilities. Also make a list of pmf that apply, when the null hypothesis proves true and correct.
When H0 is true, X~b(n, p)
N = size of the sample
P = assume value if H0 proves true.
Step 3: Find out the value of P. P-value is the probability of data that is under observation.
Rise or increase in the P value = Pr(X ≥ x)
X = observed number of successes
P value = Pr(X ≤ x).
Step 4: Demonstrate the findings or outcomes in a descriptive detailed way.
Note the:
- Sample proportion
- P-value
- The direction of difference (either increases or decreases)
Perceived Problems With the Null Hypothesis
Variable or model selection and less information in some cases are the chief important issues that affect the testing of the null hypothesis. Statistical tests of the null hypothesis are reasonably not strong. There is randomization about significance. (Gill, 1999) The main issue with the testing of the null hypothesis is that they all are wrong or false on a ground basis.
There is another problem with the a-level. This is an ignored but also a well-known problem. The value of a-level is without a theoretical basis and thus there is randomization in conventional values, most commonly 0.q, 0.5, or 0.01. If a fixed value of a is used, it will result in the formation of two categories (significant and non-significant) The issue of a randomized rejection or non-rejection is also present when there is a practical matter which is the strong point of the evidence related to a scientific matter.
The P-value has the foremost importance in the testing of null hypothesis but as an inferential tool and for interpretation, it has a problem. The P-value is the probability of getting a test statistic at least as extreme as the observed one.
The main point about the definition is: Observed results are not based on a-value
Moreover, the evidence against the null hypothesis was overstated due to unobserved results. A-value has importance more than just being a statement. It is a precise statement about the evidence from the observed results or data. Similarly, researchers found that P-values are objectionable. They do not prefer null hypotheses in testing. It is also clear that the P-value is strictly dependent on the null hypothesis. It is computer-based statistics. In some precise experiments, the null hypothesis statistics and actual sampling distribution are closely related but this does not become possible in observational studies.
Some researchers pointed out that the P-value is depending on the sample size. If the true and exact difference is small, a null hypothesis even of a large sample may get rejected. This shows the difference between biological importance and statistical significance. (Killeen, 2005)
Another issue is the fix a-level, i.e., 0.1. On the basis, if a-level a null hypothesis of a large sample may get accepted or rejected. If the size of simple is infinity and the null hypothesis is proved true there are still chances of Type I error. That is the reason this approach or method is not considered consistent and reliable. There is also another problem that the exact information about the precision and size of the estimated effect cannot be known. The only solution is to state the size of the effect and its precision.
Null Hypothesis Examples
Here are some examples:
Example 1: Hypotheses with One Sample of One Categorical Variable
Among all the population of humans, almost 10% of people prefer to do their task with their left hand i.e. left-handed. Let suppose, a researcher in the Penn States says that the population of students at the College of Arts and Architecture is mostly left-handed as compared to the general population of humans in general public society. In this case, there is only a sample and there is a comparison among the known population values to the population proportion of sample value.
- Research Question: Do artists more expected to be left-handed as compared to the common population persons in society?
- Response Variable: Sorting the student into two categories. One category has left-handed persons and the other category have right-handed persons.
- Form Null Hypothesis: Arts and Architecture college students are no more predicted to be lefty as compared to the common population persons in society (Lefty students of Arts and Architecture college population is 10% or p= 0.10)
Example 2: Hypotheses with One Sample of One Measurement Variable
A generic brand of antihistamine Diphenhydramine making medicine in the form of a capsule, having a 50mg dose. The maker of the medicines is concerned that the machine has come out of calibration and is not making more capsules with the suitable and appropriate dose.
- Research Question: Does the statistical data recommended about the mean and average dosage of the population differ from 50mg?
- Response Variable: Chemical assay used to find the appropriate dosage of the active ingredient.
- Null Hypothesis: Usually, the 50mg dosage of capsules of this trade name (population average and means dosage =50 mg).
Example 3: Hypotheses with Two Samples of One Categorical Variable
Several people choose vegetarian meals on a daily basis. Typically, the researcher thought that females like vegetarian meals more than males.
- Research Question: Does the data recommend that females (women) prefer vegetarian meals more than males (men) regularly?
- Response Variable: Cataloguing the persons into vegetarian and non-vegetarian categories.
Grouping Variable: Gender - Null Hypothesis: Gender is not linked to those who like vegetarian meals. (Population percent of women who eat vegetarian meals regularly = population percent of men who eat vegetarian meals regularly or p women = p men).
Example 4: Hypotheses with Two Samples of One Measurement Variable
Nowadays obesity and being overweight is one of the major and dangerous health issues. Research is performed to confirm that a low carbohydrates diet leads to faster weight loss than a low-fat diet.
- Research Question: Does the given data recommend that usually, a low-carbohydrate diet helps in losing weight faster as compared to a low-fat diet?
- Response Variable: Weight loss (pounds)
- Explanatory Variable: Form of diet either low carbohydrate or low fat
- Null Hypothesis: There is no significant difference when comparing the mean loss of weight of people using a low carbohydrate diet to people using a diet having low fat. (population means loss of weight on a low carbohydrate diet = population means loss of weight on a diet containing low fat).
Example 5: Hypotheses about the relationship between Two Categorical Variables
A case-control study was performed. The study contains nonsmokers, stroke patients, and controls. The subjects are of the same occupation and age and the question was asked if someone at their home or close surrounding smokes?
- Research Question: Did second-hand smoke enhance the chances of stroke?
- Variables: There are 02 diverse categories of variables. (Controls and stroke patients) (whether the smoker lives in the same house). The chances of having a stroke will be increased if a person is living with a smoker.
- Null Hypothesis: There is no significant relationship between a passive smoker and stroke or brain attack. (odds ratio between stroke and the passive smoker is equal to 1).
Example 6: Hypotheses about the relationship between Two Measurement Variables
A financial expert observes that there is somehow a positive and effective relationship between the variation in stock rate price and the quantity of stock bought by non-management employees
- Variables: The response variable is daily price alteration data and information and the explanatory variable is previous day stock bought by non-management employees. These are two different measurement variables. There are 02 different variables for measurement.
- Response variable- Regular alteration in price
- Explanatory Variable- Stock bought by non-management employees
- Null Hypothesis: The association and relationship between the regular stock price alteration ($) and the daily stock-buying by non-management employees ($) = 0.
Example 7: Hypotheses about comparing the relationship between Two Measurement Variables in Two Samples
- Research Question: Is the relation between the bill paid in a restaurant and the tip given to the waiter, is linear? Is this relation different for dining and family restaurants?
- Variables: There are 02 diverse and divergent categories of variables. The amount of tip depends on the total bill.
- Explanatory Variable- total bill amount
- Response Variable- the amount of tip
- Null Hypothesis: The relationship and association between the total bill quantity at a family or dining restaurant and the tip, is the same.
Try to answer the quiz below to check what you have learned so far about the null hypothesis.

References
- Blackwelder, W. C. (1982). “Proving the null hypothesis” in clinical trials. Controlled Clinical Trials, 3(4), 345–353.
- Frick, R. W. (1995). Accepting the null hypothesis. Memory & Cognition, 23(1), 132–138.
- Gill, J. (1999). The insignificance of null hypothesis significance testing. Political Research Quarterly, 52(3), 647–674.
- Killeen, P. R. (2005). An alternative to null-hypothesis significance tests. Psychological Science, 16(5), 345–353.
©BiologyOnline.com. Content provided and moderated by Biology Online Editors.