
Demographic transition
n., plural: demographic transitions
[ˌdɛm.əˈɡɹæf.ɪk tɹænˈsɪʃ(ə)n]
Definition: the transition from high birth and death rates to low birth and death rates during an industrial revolution
Table of Contents
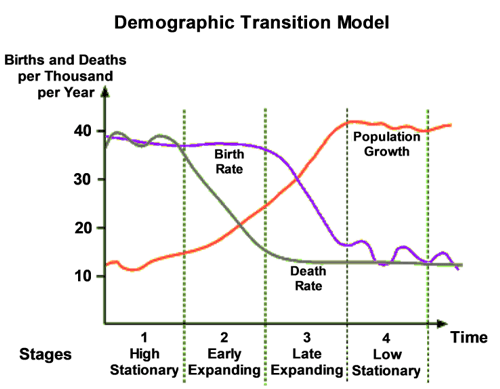
The demographic transition model is a theoretical framework that explains the historical shift in population dynamics as a result of economic and social development. It postulates that populations tend to experience high birth and death rates during pre-industrial stages (slow rate of population growth.) As societies develop and experience improvements in healthcare and living standards, death rates decrease (rapid population growth).
Human beings are one of the most common subjects of interest for scientists interested in statistical studies. Comparing different parameters and characters among the different populations of human beings helps in getting a bird’s view of how the population behaves. The study field of “demography” has become highly popular because of its significance and relevance to global politics, the economy, and peace. Hence, the statistical study of human populations started being discussed under the heading of demographic studies.
Within demography, several phenomena are discussed; one of which is “demographic transition”. This article will cover some of the major aspects of demographic transition ranging from its stages, historical significance, and effects. As you proceed, you will learn:
- What is the demographic transition? Or how to define demographic transition?
- What is an example of demographic transition theory?
- What causes the demographic transition?
Read on to learn more about this phenomenal phenomenon.
Demographic Transition Definition
Demographic transition is defined as the change in patterns of birth rates and death rates as a city, a country, or a continent transitions through increased industrialization or the industrial revolution.
The theory emphasizes the point that the boost in economy and industrial growth directly affect the population structure of human beings.
As more amount of money is pumped into the national or international economic systems, the overall fecundity (birth rate) and mortality (death rate) decline.

-
Observation for the establishment of theory
The theory revolves around some common observations like:
- Observation-1: The demarcated regions (nations) in pre-industrial societies were quite poor. Due to the lack of money, education, technology, and awareness, both birth and death rates used to be quite high.
- Observation -2: As the societies progressed with a boost in economies and open opportunities for learning and education, transitioning death rates were observed (“a significant decline”). Additionally, as the health care system became more sophisticated and better in terms of functions and facilities, this number became statistically significant. The increase in general awareness about health, finance, education, and sanitation led to an increase in the life expectancies of human beings.
- Observation -3: As societies became more intellectual and freedom of opinions started getting a nod due to more urbanization, awareness about women’s rights, the idea of consent, access to technology, etc, several taboos could be broken and a final break could be applied to birth rates. A generalized observation of an increase in wages, acceptability, and accessibility to birth control (contraception) procedures, improved status of women, and other overall societal changes contributed to regulation in birth rates (fertility regulation). It is at this stage (stage-3) that population growth started to level off.
- Observation -4: At this stage, the decline in both birth and death rates becomes highly dangerous as they indicate a shrinking population.

Watch this vid about demographic transition:
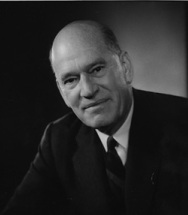
A demographic transition is a concept in demography that elucidates the transition from high to low birth and death rates as a country or a region develops from a pre-industrial to an industrialized economic system. This theory was proposed by Warren Thompson, an American demographer, in 1929.
Stages:
Demographic transition refers to the theory regarding the transition occurring in a population in a country or a region. Accordingly, as societies grow increasingly wealthy, the tendency of birth and death rates is to decline. Initially, there are high birth and death rates (stage one). The death rates and birth rates are high and about the same. This occurs in a pre-industrial society. As society is progressing (developing), the death rates drop quickly (stage two). The possible cause of the decline is the improvement in food and sanitation, which in turn reduces the risk of contracting diseases and relatively longer life expectancies. This is next followed by a decline in birth rates (stage three). Possible factors that curbed the rate of births are the increase in wages, access to contraceptive methods, urbanization, improved status of women, and other social changes. At this time, the growth of the population starts to level off. This phase is followed by a decline in both the birth rates and the death rates (stage four). At this stage, there is a risk of a shrinking population.
Abbreviation/Acronym: DT
History

Warren Thompson, an American demographer, is credited with developing the original interpretation of demographic history that served as the “foundation for the demographic transition theory” in 1929. Thompson’s work on the demographic transition theory was influential in shaping subsequent research on population dynamics and fertility transition rates, and his ideas continue to be studied and refined by demographers and social scientists today in form of Warren Thompson’s demographic transition model.

French demographer Adolphe Landry also made similar observations on demographic patterns and human population growth potential in 1934. He contributed to the development of the demographic transition theory by making observations on demographic patterns and population growth potential. His work mainly helped to further “refine the theory” and “provided additional evidence for the negative correlation between natural fertility and industrial development” that forms the basis of the theory. Landry’s ideas have had a lasting impact on the field of demography.

Frank W. Notestein was another American demographer who contributed to the development of demographic transition theory by formalizing the concept in the 1940s and 1950s. He defined the “stages of demographic transition” and emphasized the “role of socio-economic development factors” in driving changes in age-specific fertility rates. Notestein’s work helped to refine the theory and popularize its use in academic circles.
By 2009, the negative correlation between fertility behavior and industrial development had become widely accepted in the social sciences. This correlation forms the basis of the demographic transition theory and has been observed in many different countries and regions around the world.
Quick Facts!
The Jews of Bohemia and Moravia were among the first populations to experience a demographic transition, beginning in the 18th century. This transition occurred before changes in mortality or human fertility rates in other European Jews or Christians living in the Czech lands, providing early evidence for the validity of the demographic transition theory.
Four/Five Stages of Demographic Transition
Let’s find out more about the demographic transition model, particularly DTM meaning and stages.
First, the definition of the demographic transition model (DTM) goes as follows:
The demographic transition model is a theoretical framework that describes the stages of population growth and demographic change in societies over time. The demographic transition model typically comprises demographic transition model stages.
As for the DTM stages, Stages 1-4 are summarized in the table below:
Demographic Transition model: DTM Stages and Features | |||
|---|---|---|---|
| Stage 1 | Stage 2 | Stage 3 | Stage 4 |
|
|
|
|
Data Source:Akanksha Saxena of Biology Online
And here’s an infographic showing Stages 1-5.

Effects on Age Structure
The demographic transition can alter the age structure of a population through changes in death and birth rates.
During stage-2 of the transition (as discussed above), a decline in death rates results in an increase in the younger population, due to lower infant mortality and child mortality rates (age-specific mortality rates) and increased child survival.
As individuals with increased survival rates age, there is an increase in the number of older children, teenagers, and young adults, which increases the proportion of the fertile population.
The stage-2 of the demographic transition creates a youth bulge and a rise in child dependency.

Stage-3 witnessed a fertility decline and the youth bulged aging into the working ages, known as the golden age.
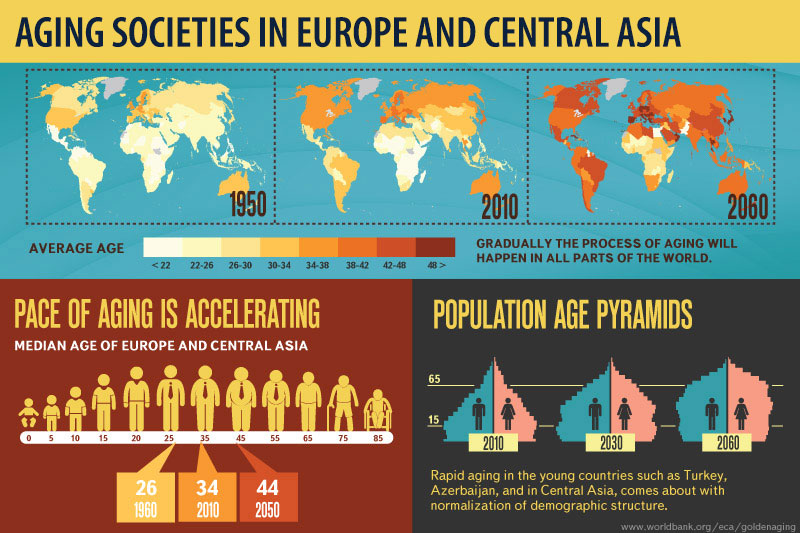
However, continued declines in mortality and fertility can lead to an aging population (as discussed in stage-4 above), with a rise in the aged dependency ratio, indicating that the population has reached below replacement levels of fertility and lacks enough people in working ages to support the economy.

Historical Studies
In this section, we will briefly undertake some historical studies related to population structure and demographic transition in different populations by country.
-
Britain
- 18th century: The demographic transition in Britain began in the mid-18th century, with improvements in hygiene, nutrition, and medical technology leading to a decline in mortality rates.
- 19th century: This decline in death rates continued through the nineteenth century, leading to a population boom. The birth rate also began to decline in the late 19th century, as people began to have fewer children due to changing economic and social affairs.
- 20th century: By the mid-twentieth century, Britain had completed the demographic transition, with low birth and death rates and an aging population. This transition had profound effects on British society, including changes in family structure (aiming at population control), urbanization, and the development of social welfare policies to support the elderly.
-
Ireland
- 19th century: Ireland experienced a demographic transition from the mid-19th century through the 20th century, with significant changes in population structure, birth rates, and death rates. The transition was marked by a decline in death rates due to improved living conditions, healthcare, and sanitation, and a subsequent decline in birth rates as families opted for smaller family sizes. The transition was hastened by the Great Famine in the mid-19th century, which resulted in a sharp drop in population.
- 20th century: By the mid-20th century, Ireland’s population had stabilized and the country experienced a demographic dividend as the proportion of the working-age population increased relative to dependents.
- 21st century: However, in recent years, Ireland has seen a slight increase in birth rates and an aging population, potentially signaling a shift towards an aging population structure.

-
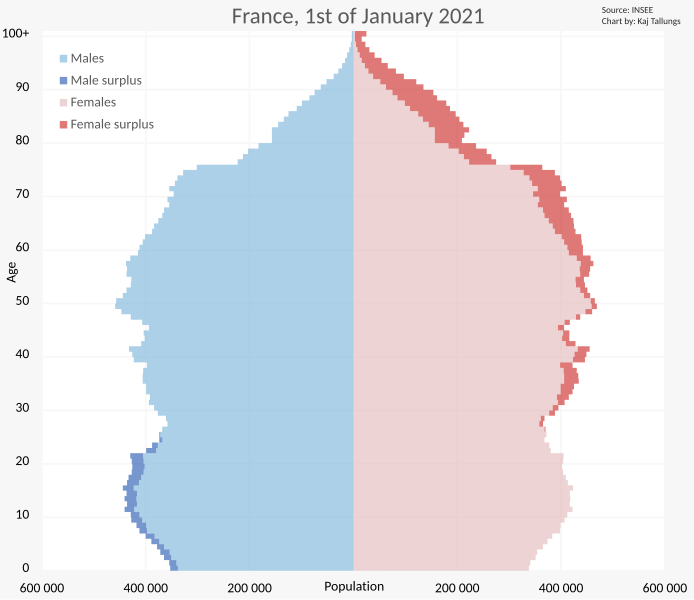
France
- 18th century: France experienced the demographic transition from the mid-18th century with major reductions in mortality rates.
- 19th century: A significant decline in fertility rates was observed from the late-19th century.
- 20th century: In the early 20th century, France entered the third stage of the transition with very low fertility rates, leading to population stagnation and aging.
- 21st century: Today, France has one of the highest life expectancies in the world, but its fertility rate remains below replacement level, resulting in an aging population and the need for policies to address the economic and social implications of demographic trends.

-
Asia
The demographic transition in Asia varies widely among countries due to differences in social, economic improvement, and cultural factors. Some countries, such as Japan and South Korea, have completed the demographic transition and are experiencing low fertility rates and an aging population. In contrast, countries like India and Indonesia are still in the early stages of the transition with high birth and death rates.
Rapid urbanization, changing social norms, and improvements in healthcare and education are some of the factors that have contributed to the demographic transition in Asia.
The transition presents both opportunities and challenges for the region, including the need for adequate infrastructure and social welfare systems to support aging populations and increasing demands for education and employment opportunities for younger generations.
-
-
India
-
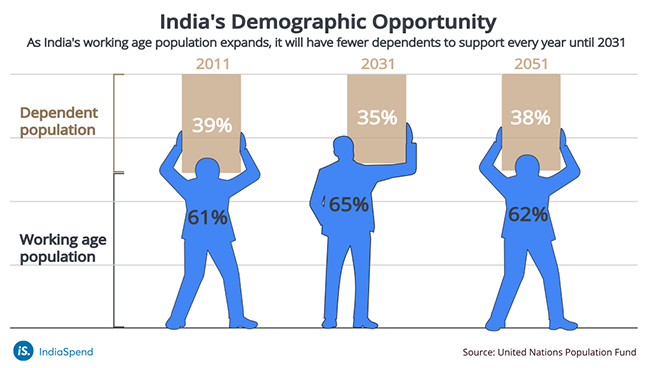
India is currently in the midst of its demographic transition. India’s population is projected to peak at around 1.6 billion in the mid-2060s before stabilizing or declining. The country experienced a rapid decline in death rates during the 2nd half of the 20th century, leading to a substantial increase in population size. However, birth rates have also been declining, though at a slower pace, resulting in a shift towards an older age structure.
India’s fertility rate has fallen from around 6 children per woman in the 1950s to just over 2 in recent years but remains higher than many other countries in the world. This demographic shift presents both opportunities and challenges for India’s economy and social policies, including the need to provide healthcare, education, family planning programs, and employment opportunities for an increasingly aging population.

-
-
Korea
-
South Korea has experienced a rapid demographic transition over the past few decades. In the 1960s, the country was in the early stages of transition with high birth and death rates. However, due to improved healthcare, education, and economic development, the country quickly moved through the stages of transition and now has low birth and death rates. This has resulted in an aging population with a low fertility rate and a growing number of elderly dependents.
This presents challenges for the economy and social welfare system, but the government has implemented policies to encourage fertility and support elderly citizens, such as the introduction of paid parental leave and increased funding for elderly care.
-
Madagascar
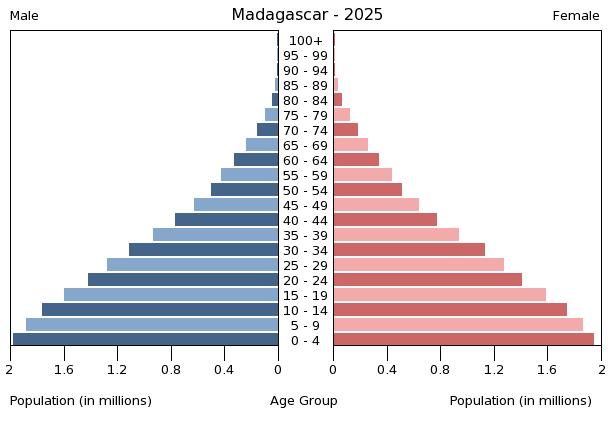
Madagascar, an island nation located off the southeast coast of Africa, is still in the early stages of a demographic transition. The birth rates remain high in the country with a high infant mortality rate, resulting in a relatively young population. However, Madagascar has made progress in reducing its fertility rate through improved healthcare and education, which has led to a decrease in the birth rate and growth of the human population over time.
The life expectancy of the population has also increased due to better access to healthcare, resulting in a decrease in the death rate.
Madagascar is currently in the midst of a demographic transition, with the potential to achieve a higher level of economic and social development as it moves towards lower birth and death rates.

-
Russia
Russia experienced a demographic transition that occurred in several stages throughout its history.
The first stage was characterized by high birth rates and high mortality rates, resulting in slow population growth.
The second stage saw a decline in mortality rates due to improved healthcare, leading to a population growth rate of more than 1% per year (rapid population growth).
The third stage, starting in the 1960s, was marked by a decline in fertility rates and a stabilization of population growth.
Currently, Russia is experiencing a decline in population due to a low birth rate and high mortality rate, which is attributed to factors such as alcohol abuse, smoking, and poor healthcare.
The Russian government has implemented policies to address this issue, including incentives for larger families and improvements in healthcare.
-
United States
The United States experienced a demographic transition starting in the late 19th century, with a decrease in both birth and death rates. (decrease in United States population growth rate)
The transition began in urban areas, where improved sanitation and public health measures led to a decline in infectious diseases.
US population decline: This decline in death rates was followed by a decline in birth rates as more women began to enter the workforce and have fewer children, which led to a decline in the population of the United States.
The post-World War II baby boom temporarily reversed the declining birth rate trend, but it soon returned to a downward trend.
Today, the United States is in the later stages of the demographic transition, with a stable population growth rate and an aging population due to increased life expectancy and declining birth rates.
Critical Evaluation
The Demographic Transition Model (DTM) needs to be critically evaluated due to the under-listed reasons:
- DTM cannot predict the future with certainty but provides a rough idea of the future birth and death rates and the total population size for under-developed countries, and it doesn’t consider the impact of migration.
- Recent phenomena like HIV/AIDS, and waterborne bacterial infant mortality, especially in countries like Malawi, Sudan, and Nigeria, are not accounted for in the DTM.
- The DTM assumes that population changes are driven by industrial changes and increased wealth, overlooking the role of social change, such as women’s education, in determining birth rates. Nonetheless, government programs and massive investments in education have played a significant role in the rapid decline in fertility in developing countries.
Second Demographic Transition
The Second Demographic Transition is a theory that describes social and demographic changes that have occurred in some developed countries (industrialized countries) since the 1960s, including a shift towards individualism, gender equality, postponement of marriage and childbearing, and non-traditional family forms, resulting in declining fertility rates and aging populations.
Contradictions to Demographic Transition
The demographic transition theory assumes that fertility rates decrease as countries progress through economic and social development. However, there are instances where this trend does not hold. For example, some countries have experienced an increase in fertility rates despite achieving a high level of economic development. This is evident in some European countries, such as France and Sweden (high fertility), where the fertility rate has remained stable or increased in recent years, despite having high levels of economic development. (Ref.1,2)
Another contradiction to the demographic transition theory is the effect of cultural and social factors on fertility rates. For example, some countries with high levels of economic development have a cultural preference for small families. This is evident in some Asian countries, such as Japan and South Korea, where the fertility rate remains low despite economic development due to a cultural emphasis on both career advancement as well as family life. (Ref.3,5)
The demographic transition theory also assumes a negative linear relationship between economic development and fertility rates, but this relationship may not hold in all contexts. In some cases, economic development may lead to an increase in fertility rates due to increased access to healthcare and education. For example, in sub-Saharan Africa, economic growth has been linked to an increase in fertility rates, as improved healthcare has reduced infant mortality rates and increased life expectancy, leading to larger family sizes. (Ref.4)

Points to Ponder:
- Does the theory sound coherent with both “developed” (industrialized) and “developing” countries?
- Do the “country-specific social, economic, and political factors” play a more significant role than the generalized “demographic transition model” in determining the country’s trend?
- Do industrialization and improved economic status lead to a decline in population or decline in a population provide an opportunity for industrialization, thereby improving the economic status of the masses? What is the “cause” and what is the “effect/consequence” is still debatable.
- Can the structure of the human population be influenced, either directly or indirectly, by factors such as old-age security, increased per capita income, greater demand for human capital, and reduced mortality, and are these factors interrelated or correlated with each other?
FAQs
- What’s the population of the world? Approximately 8 billion
- What is the current population of the world? 8,024,270,921

Figure 14: A world population graph showing how population growth continues at nearly 0.84& growth rate. Image Credit: Statista. - Does Advanced Placement Human Geography (AP Human Geography) cover demography and related theories? Advanced Placement Human Geography is a social studies course for high school students in the United States that focuses on human geography. DTM AP human geography is covered thoroughly in the course.
- What is the estimated world population decline in the coming decade? 0.9%
- What is a demographic equation? The demographic equation is a mathematical formula used to estimate population changes over time.
- Demographics examples/ demographic characteristics/ demographic variables? Age, gender, race, ethnicity, education level, income, occupation, marital status, geographic location, and household size
- Name the most populous countries. China, India (largest populations in the world)
- Name the most populous countries in Africa. Nigeria > Ethiopia> Egypt
- What is the migration transition model (MTM)? MTM is a concept that describes the changes in human migration patterns that occur as a society undergoes economic and social development.
- What is a demographic table? A table that presents statistical information on the population of a specific geographic area, such as a country or a region
- What is neolithic demographic transition? The Neolithic Demographic Transition (NDT) is a term used to describe the shift in human population from small, mobile, and relatively egalitarian groups of hunter-gatherers to larger, settled, and hierarchically structured societies engaged in agriculture.
- What is demographic evolution? Demographic evolution refers to the changes that occur in a population over time, particularly with regard to its size, composition, and distribution.
- What is the crude birth rate? Crude birth rate (CBR) is a demographic indicator that measures the number of births in a population over a specific period of time, usually expressed as a rate per 1,000 individuals. Crude birth rates are often used as an indicator of population growth or decline.
Take the Demographic transition – Biology Quiz!

References
- Hoem, J. M. (2005). Why does Sweden have such high fertility?. Demographic research, 13, 559-572.
- Toulemon, L., Pailhé, A., & Rossier, C. (2008). France: High and stable fertility. Demographic research, 19, 503-556.
- White, M. (2002). Perfectly Japanese: Making families in an era of upheaval (Vol. 14). Univ of California Press.
- Kirk, D., & Pillet, B. (1998). Fertility levels, trends, and differentials in sub-Saharan Africa in the 1980s and 1990s. Studies in family planning, 1-22.
- Nielsen, R. W. (2016). Demographic Transition Theory and its link to the historical economic growth. Journal of Economics and Political Economy, 3(1), 32-49.
©BiologyOnline.com. Content provided and moderated by Biology Online Editors.


